A wrapper for Momocs::efourier_i() to transform a
set of Fourier coefficients into (x,y) coordinates. Used internally.
inv_efourier(coe, nb.pts = 120)Arguments
- coe
A vector with Fourier coefficients.
- nb.pts
Numeric, specifying the number of coordinates for sampling the outlines.
Value
A nb.pts x 2 matrix of (x,y) cartesian coordinates defining
single outline shape.
See also
Examples
#load data and extract the first outline
data("shells")
shape_coe <- shells$shapes$coe[1,]

#get and plot (x,y) coordinates for using different number of coordinares
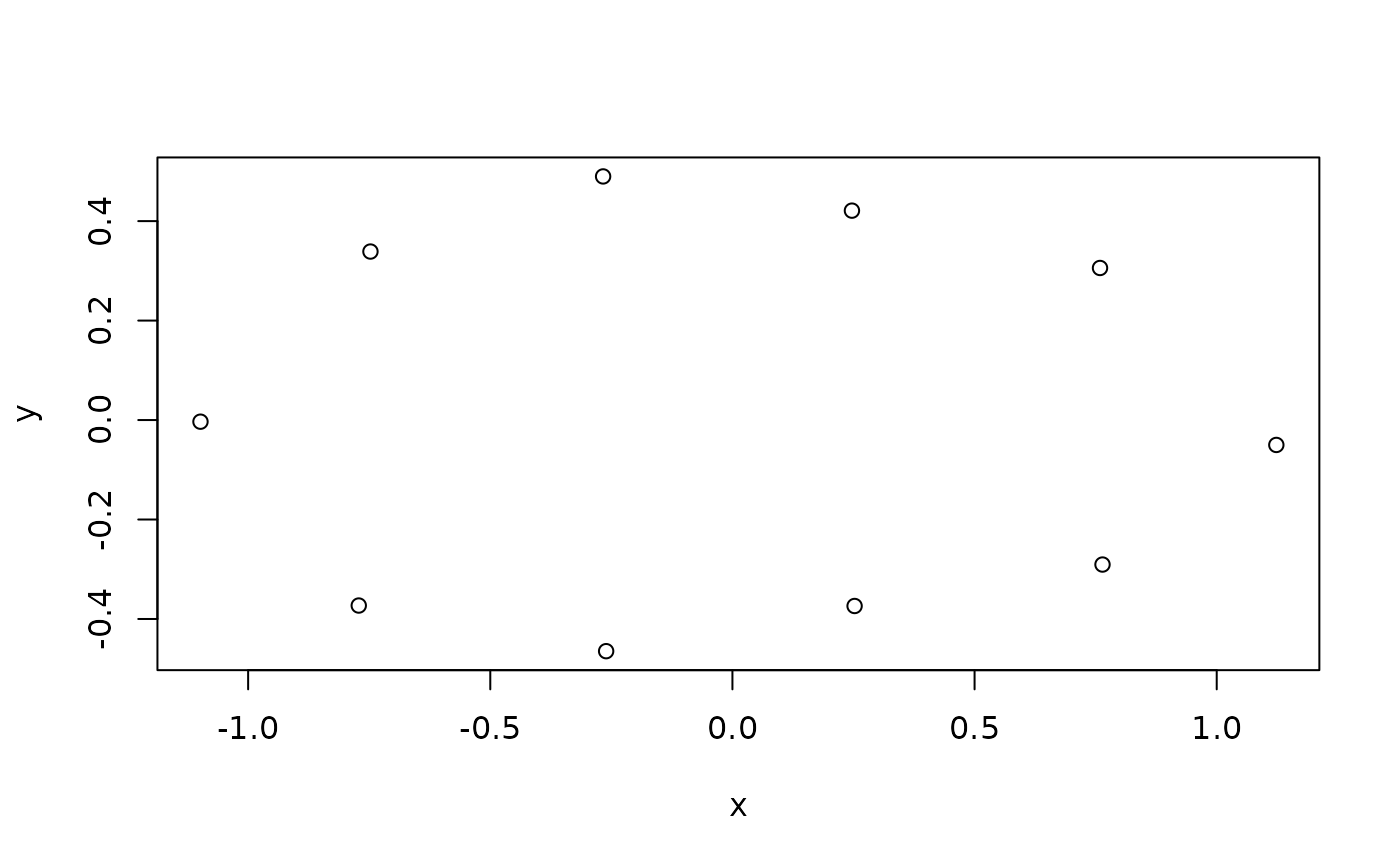
shape_xy <- inv_efourier(shape_coe, nb.pts = 10)
plot(shape_xy)

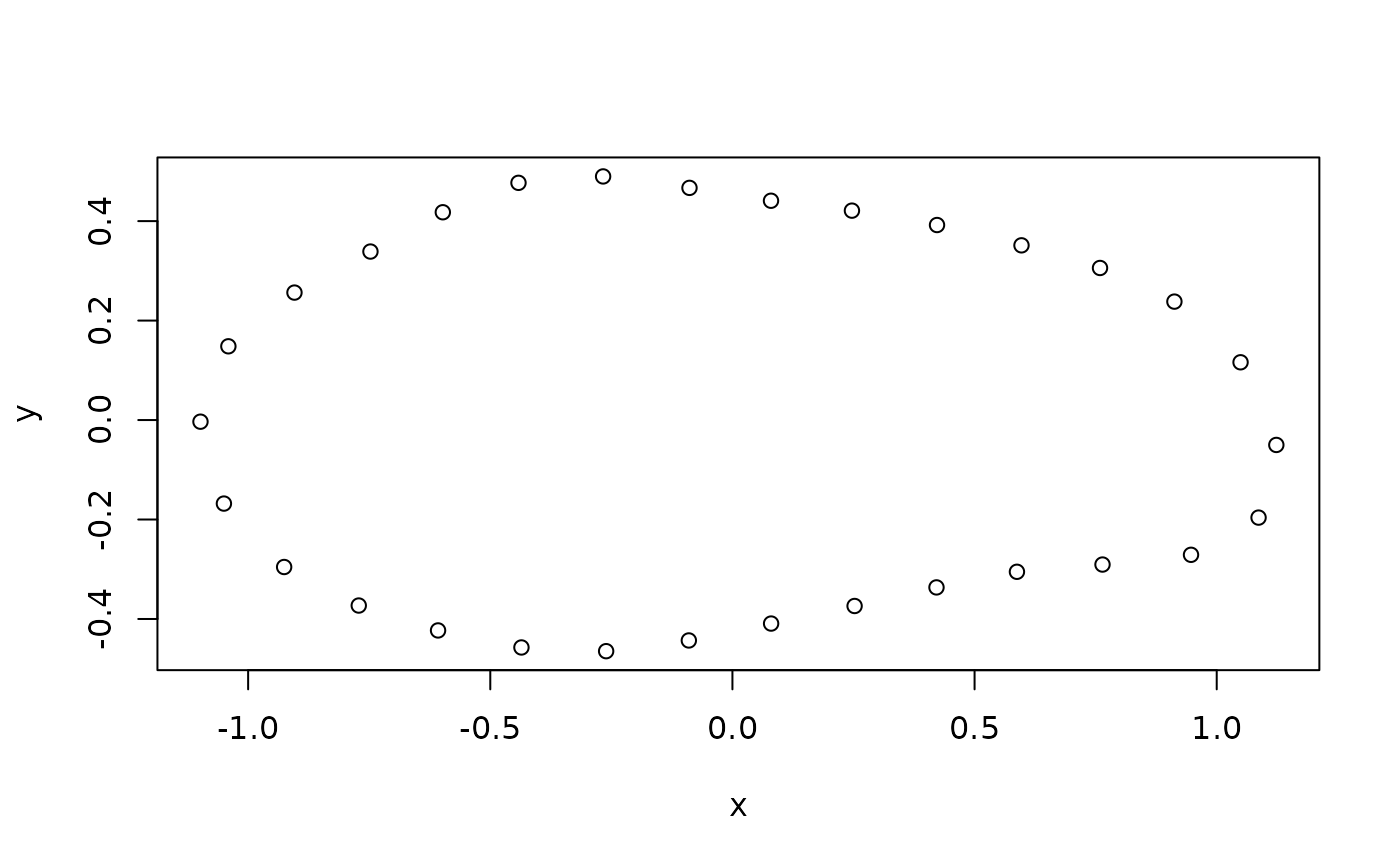
shape_xy <- inv_efourier(shape_coe, nb.pts = 30)
plot(shape_xy)

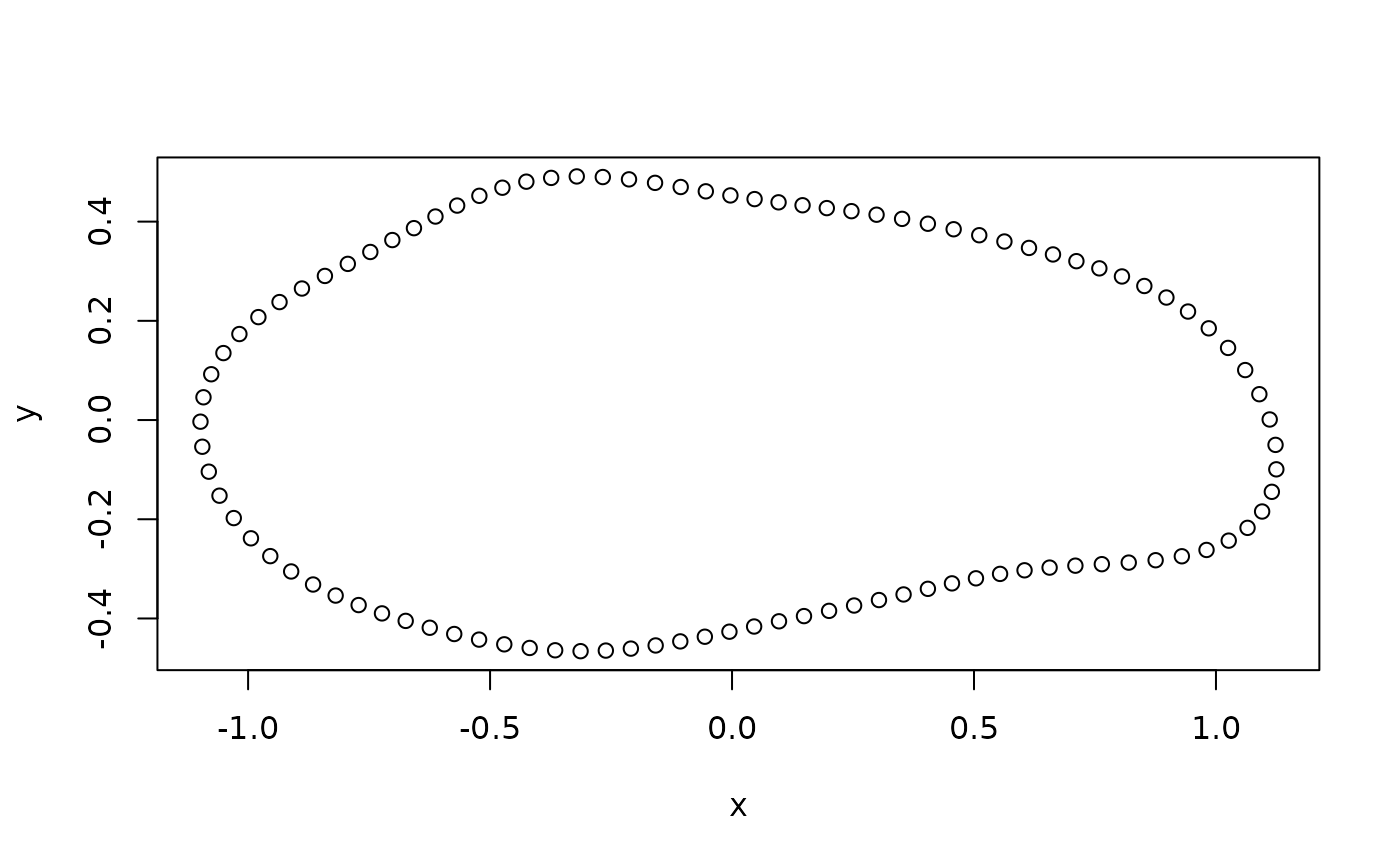
shape_xy <- inv_efourier(shape_coe, nb.pts = 100)
plot(shape_xy)
