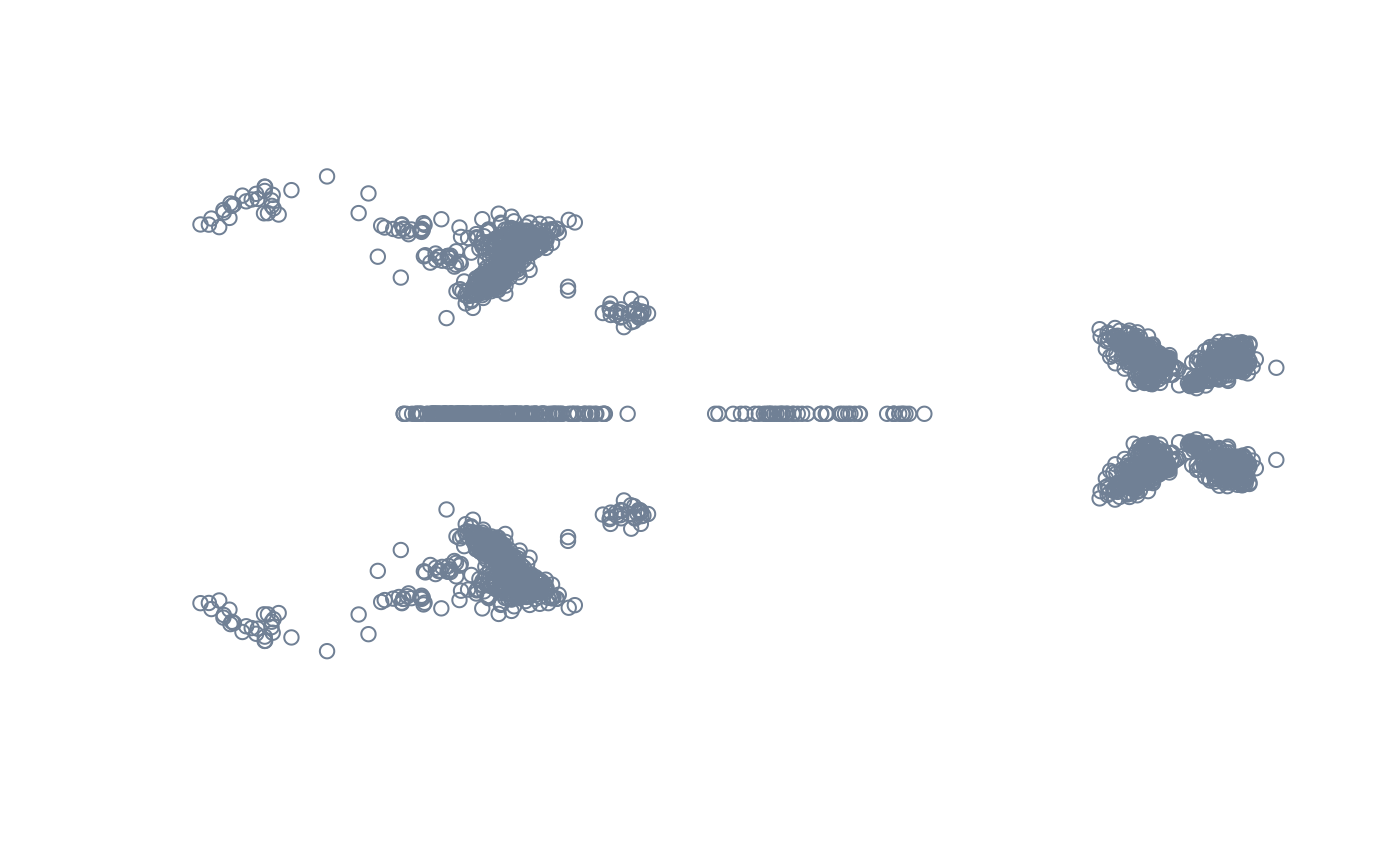
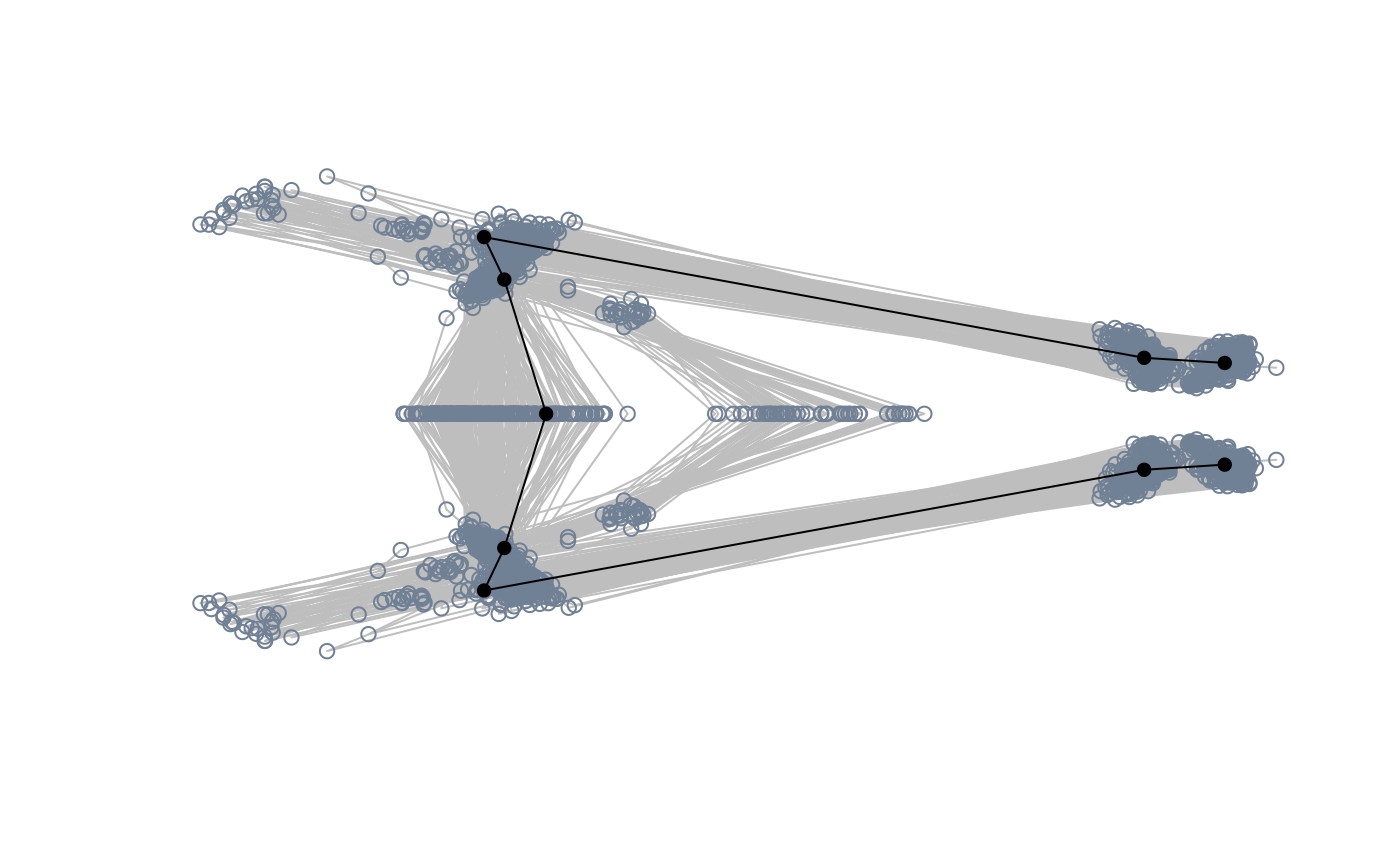
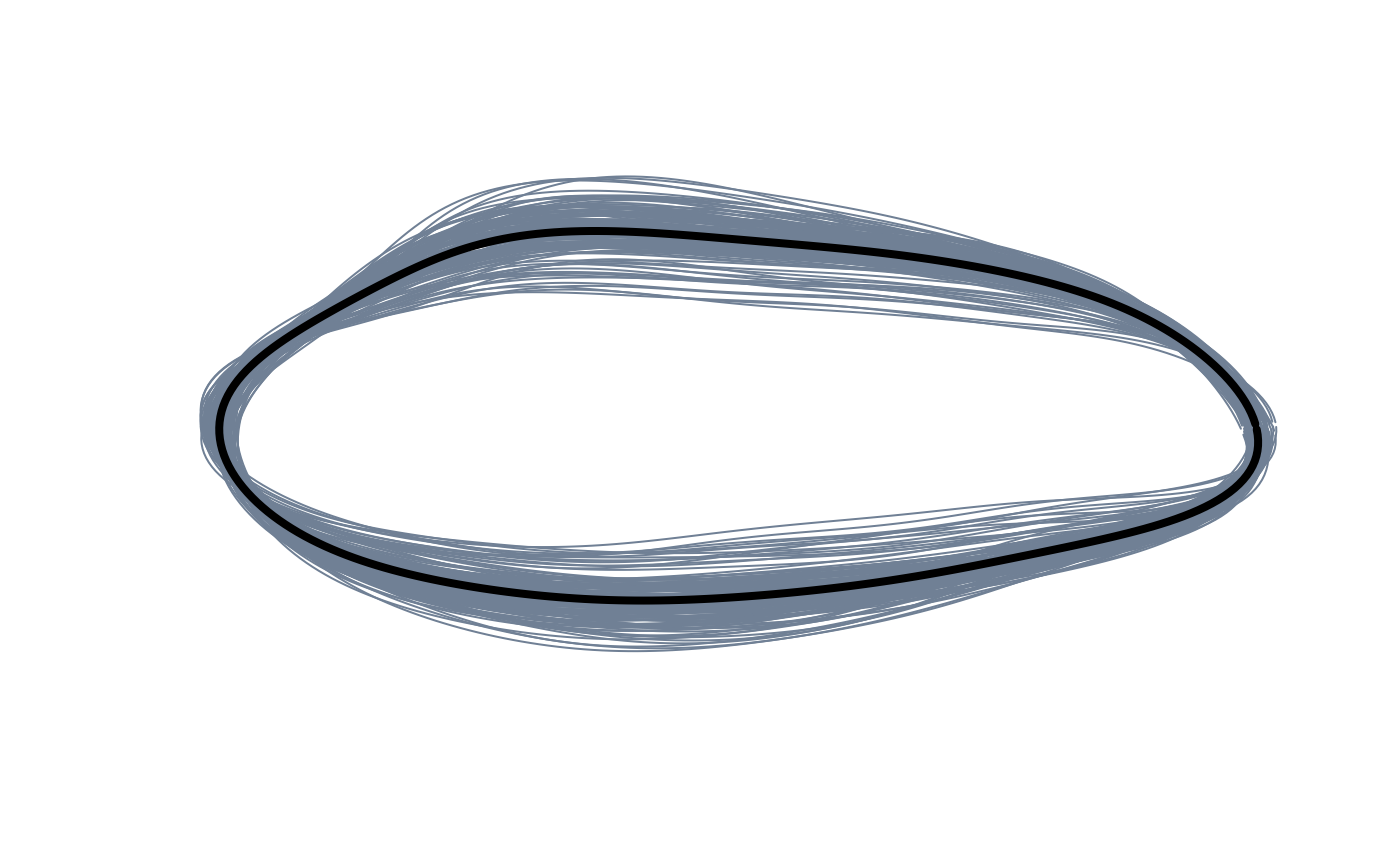
Superimpose all the shapes in the sample.
pile_shapes(shapes, links = NULL, mshape = TRUE, ...)Arguments
- shapes
Shape data.
- links
An optional list with the indices of the coordinates defining the wireframe (following the format used in
Morpho).- mshape
Logical; whether to plot the mean configuration.
- ...
Additional arguments passed to
graphics::lines()orrgl::lines3d().
Examples
#load 2D landmark data
data("tails")
shapes <- tails$shapes
links <- tails$links

#pile shapes
pile_shapes(shapes, mshape = FALSE) #bare

pile_shapes(shapes, mshape = FALSE, links = links) #with links
pile_shapes(shapes, mshape = TRUE, links = links) #with links and mean shape


#load 3D landmark data
data("shells3D")
shapes <- shells3D$shapes

if (FALSE) {
#pile shapes
pile_shapes(shapes, mshape = FALSE) #bare
pile_shapes(shapes, mshape = FALSE, links = list(1:10)) #with false links (just as an example)
pile_shapes(shapes, mshape = TRUE, links = list(1:10)) #with false links and mean shape
}


#load outline data
data("shells")
shapes <- shells$shapes
links <- shells$links

#pile shapes
pile_shapes(shapes, mshape = FALSE) #bare
pile_shapes(shapes, mshape = TRUE, links = links) #with mean shape
