Calculate and arrange background shape models for morphospaces. Used internally.
morphogrid(
  ordination,
  axes,
  datype,
  rescale = TRUE,
  template = NULL,
  x = NULL,
  y = NULL,
  p = NULL,
  k = NULL,
  nh = 5,
  nv = 4,
  mag = 1,
  asp = NA,
  xlim = NULL,
  ylim = NULL,
  rot.models = 0,
  size.models = 1,
  asp.models = 1
)
Arguments
- ordination
An ordination (i.e., a
"prcomp","bg_prcomp","phy_prcomp"or"pls_shape"object).- axes
Numeric of length 1 or 2, indicating the morphometric axes to be plotted. If values for either
xoryare provided, only the first value of this argument is considered.- datype
Character; the type of shape data (either
"fcoef"or"landm").- rescale
Logical; whether to re-scale background shape models so shape variation is shown more clearly.
- template
A 2-column matrix containing landmarks/semilandmarks followed by coordinates defining a curve or set of curves describing additional aspects of morphology, which will be warped using TPS interpolation to produce the set of background shell models (see
build_template2d).- x
Optional vector with a non-morphometric variable to be plotted in the x axis.
- y
Optional vector with a non-morphometric variable to be plotted in the y axis.
- p
Numeric, indicating the number of landmarks/semilandmarks used (for landmark data only).
- k
Numeric, indicating the number of cartesian dimensions of landmarks/semilandmarks (for landmark data only).
- nh
Numeric; the number of shape models along the x axis.
- nv
Numeric; the number of shape models along the y axis.
- mag
Numeric; magnifying factor for shape models.
- xlim, ylim, asp
Standard arguments passed to the generic plot function
- rot.models
Numeric; angle (in degrees) to rotate shape models.
- size.models
Numeric; size factor for shape models.
- asp.models
Numeric; the y/x aspect ratio of shape models.
Value
A list of length 3 containing:
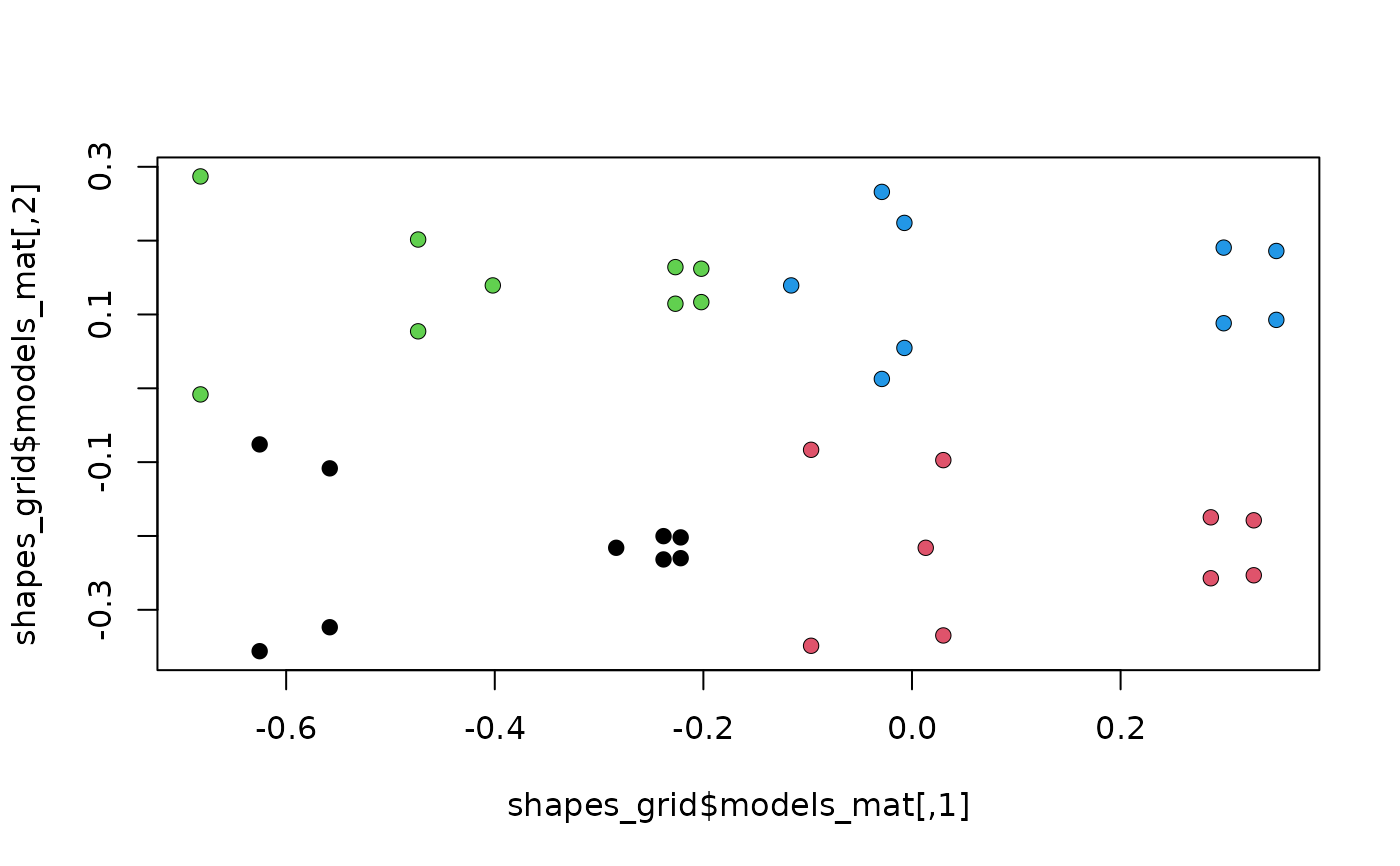
$models_mat:a 2-column matrix with the (x,y) coordinates of all the shape models in the background.$models_arr:same asmodels_matbut in 3-margins array format.$grid:coordinates marking the centroid of each shape model. Intended for internal use.
References
MacLeod, N. (2009). Form & shape models. Palaeontological Association Newsletter, 72(620), 14-27.
See also
Examples
 #load data and packages
 library(geomorph)
 data("tails")

 #perform pca on tails shapes
 pca <- prcomp(two.d.array(tails$shapes))

 #generate grid of shape models sampling the range of variation
 #at 4 locations (the 4 corners of the scatterplot)
 shapes_grid <- morphogrid(ordination = pca, axes = c(1,2), datype = "landm",
                           k = ncol(tails$shapes), p = nrow(tails$shapes),
                           nh = 2, nv = 2)

 #plot grid from $models_mat and project each shape in models_arr
 plot(shapes_grid$models_mat)
 points(shapes_grid$models_arr[,,1], pch=16, col = 1)
 points(shapes_grid$models_arr[,,2], pch=16, col = 2)
 points(shapes_grid$models_arr[,,3], pch=16, col = 3)
 points(shapes_grid$models_arr[,,4], pch=16, col = 4)
