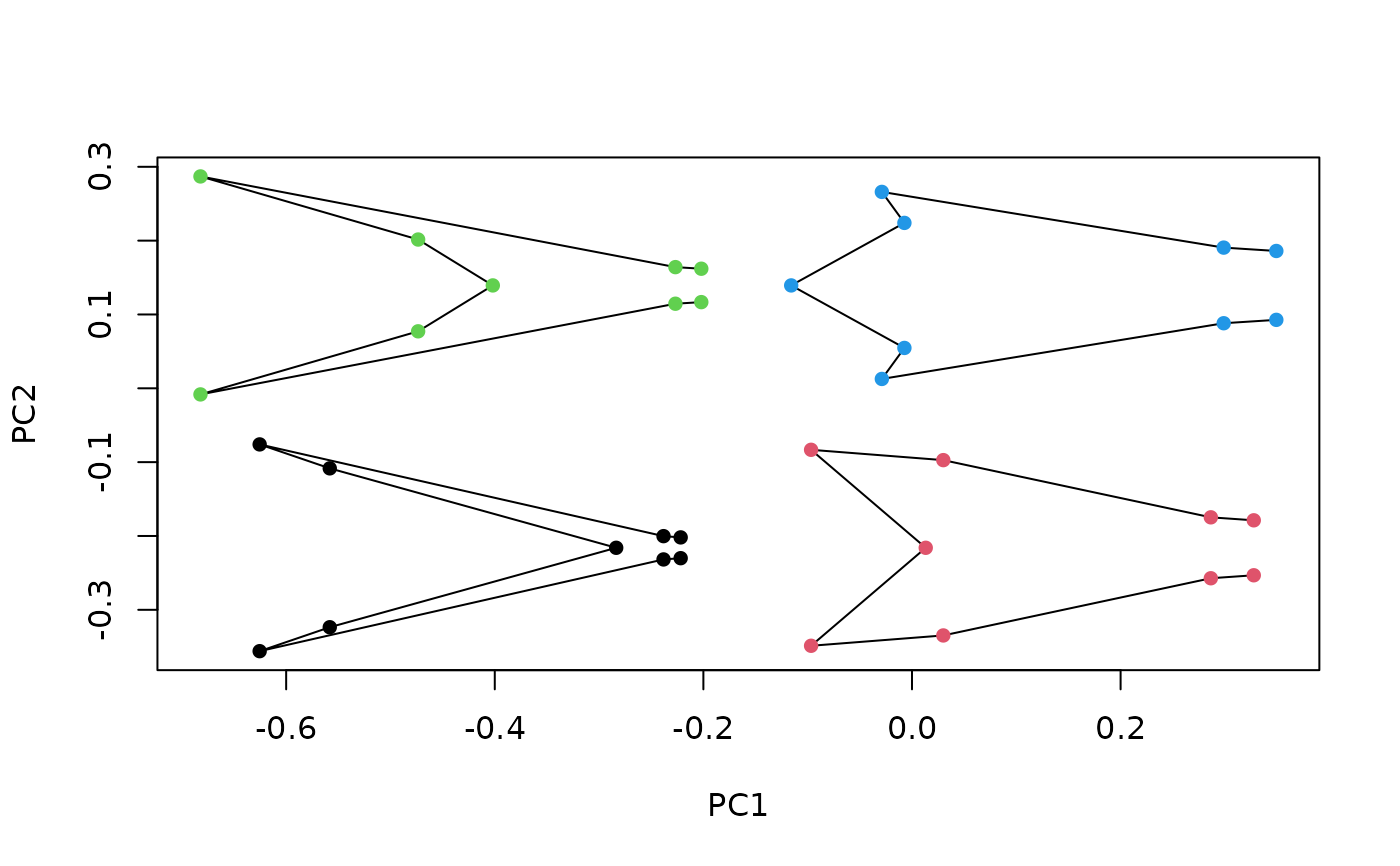
Plot the output from morphogrid(), for 2-dimensional
morphometric data. Used internally.
plot_morphogrid2d(
  x = NULL,
  y = NULL,
  morphogrid,
  template = NULL,
  links = NULL,
  datype,
  ordtype,
  axes,
  adj_frame = c(1, 1),
  p,
  xlab = NULL,
  ylab = NULL,
  cex.ldm,
  col.ldm,
  col.models,
  lwd.models,
  bg.models,
  plot = TRUE,
  models = TRUE
)
Arguments
- x
Optional vector with a non-morphometric variable to be plotted in the x axis.
- y
Optional vector with a non-morphometric variable to be plotted in the y axis.
- morphogrid
An object containing the output of
morphogrid.- template
A 2-column matrix containing landmarks/semilandmarks followed by coordinates defining a curve or set of curves describing additional aspects of morphology, which will be warped using TPS interpolation to produce the set of background shell models (see
build_template2d).- links
A list with the indices of the coordinates defining the wireframe (following the format used in
Morpho).- datype
Character; type of shape data used (
"landm"or"fcoef").- ordtype
Character; method used for multivariate ordination (
"prcomp","bg_prcomp","phy_prcomp","pls_shapes"or"phy_pls_shapes").- axes
Numeric of length 2, indicating the axes to be plotted.
- adj_frame
Numeric of length 2, providing a posteriori scaling factors for the width and height of the frame, respectively.
- p
Numeric, indicating the number of landmarks/semilandmarks used (for landmark data only).
- xlab, ylab
Standard arguments passed to the generic plot function.
- cex.ldm
Numeric; size of landmarks/semilandmarks in the background models.
- col.ldm
The color of landmarks/semilandmarks in the background models.
- col.models
The color for wireframes/outlines.
- lwd.models
Numeric; the width of the lines in wireframes/outlines.
- bg.models
Background color for outlines.
- plot
Logical; whether to plot morphospace.
- models
Logical; whether to plot background shape models.
See also
Examples
#load data and packages
library(geomorph)
data("tails")

#perform pca on tails shapes
pca <- prcomp(two.d.array(tails$shapes))

#generate grid of shape models sampling the range of variation
#at 4 locations (the 4 corners of the scatterplot)
shapes_grid <- morphogrid(ordination = pca, axes = c(1,2), datype = "landm",
                          k = ncol(tails$shapes), p = nrow(tails$shapes),
                          nh = 2, nv = 2)

#plot grid
plot_morphogrid2d(morphogrid = shapes_grid, links = tails$links,
                  datype = "landm", ordtype = "prcomp",
                  axes = c(1,2), p = 9, col.ldm = 1, cex.ldm = 1,
                  col.models = 1, lwd.models = 1)

#project each shape in models_arr
points(shapes_grid$models_arr[,,1], pch=16, col = 1)
points(shapes_grid$models_arr[,,2], pch=16, col = 2)
points(shapes_grid$models_arr[,,3], pch=16, col = 3)
points(shapes_grid$models_arr[,,4], pch=16, col = 4)
