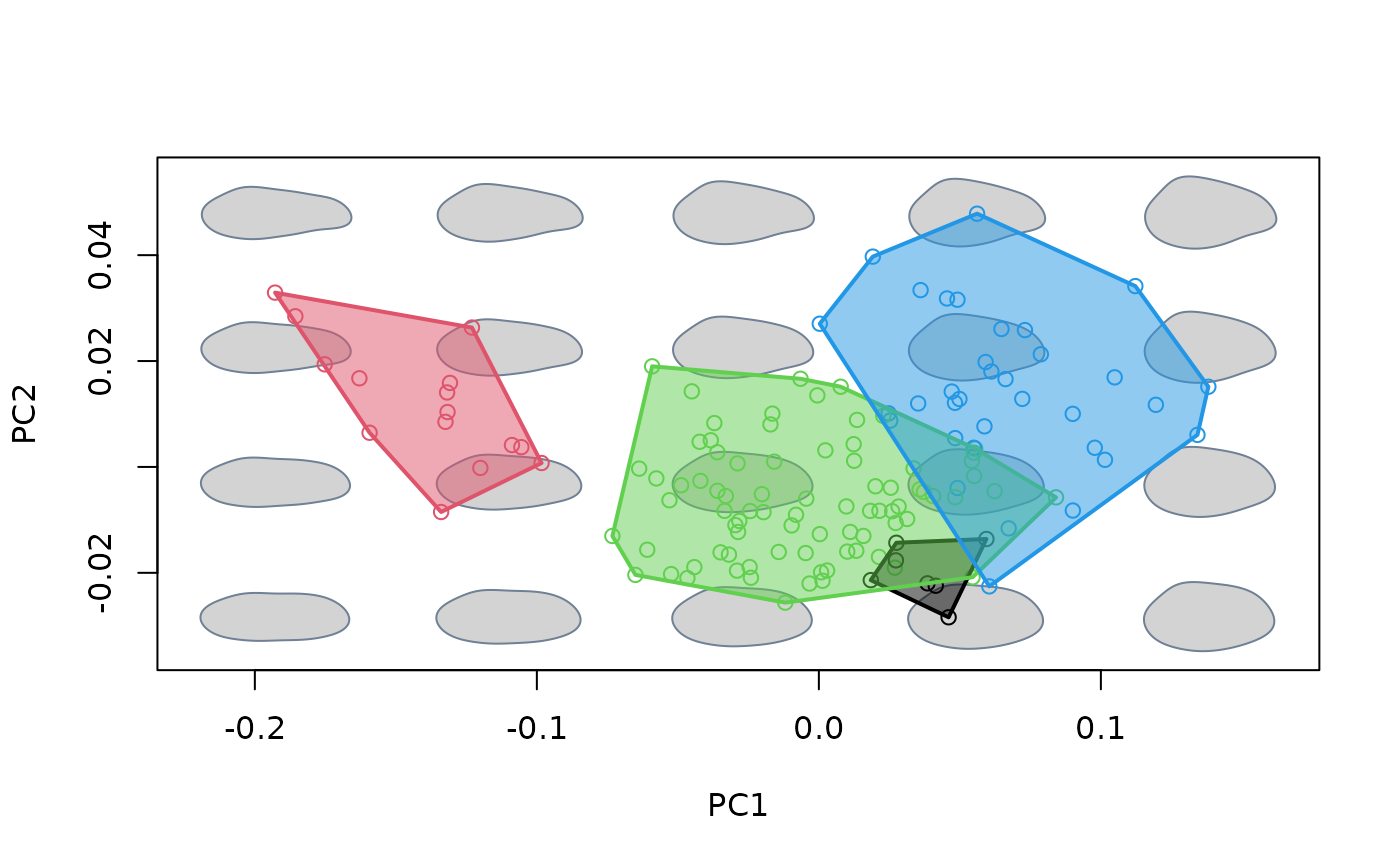
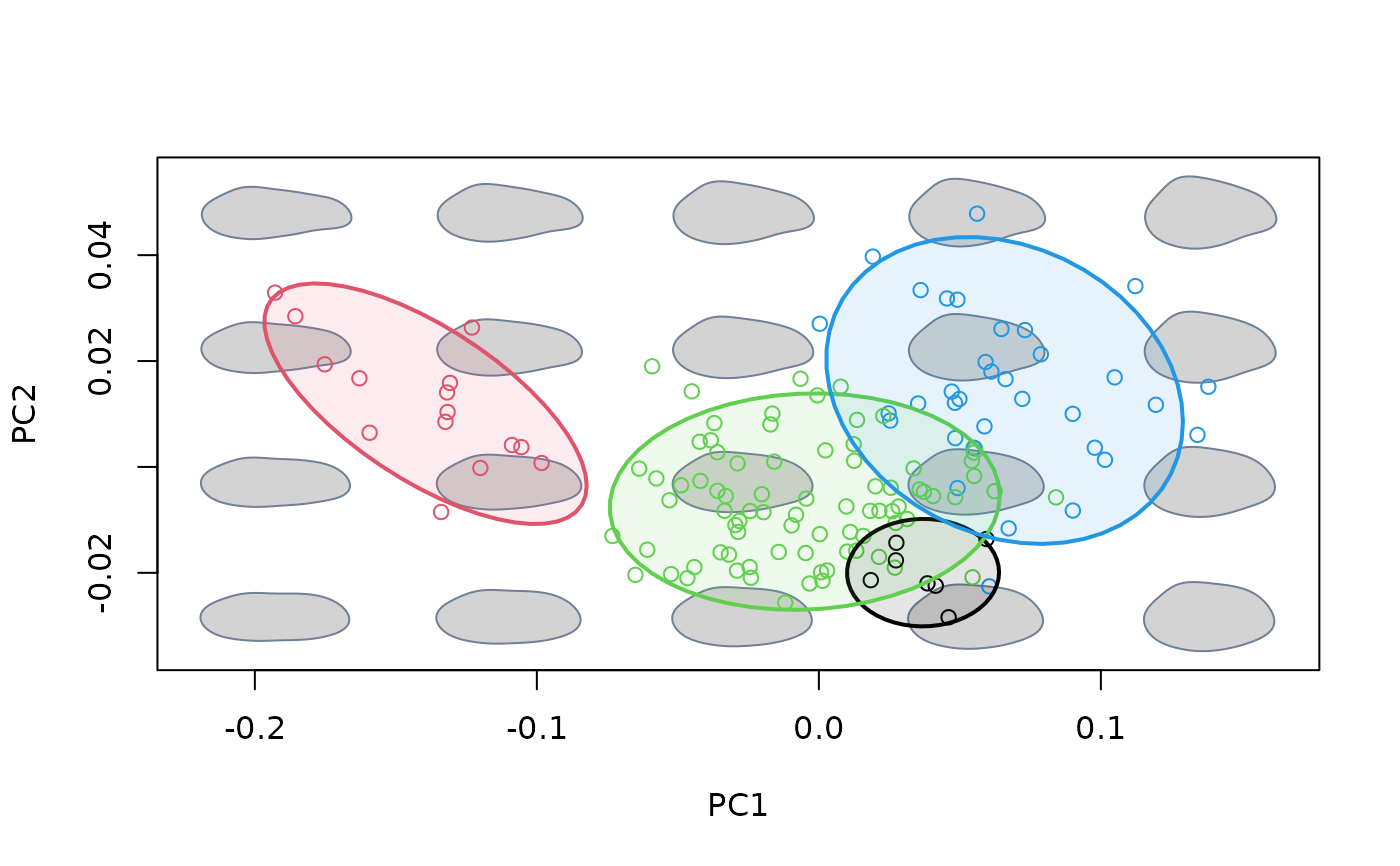
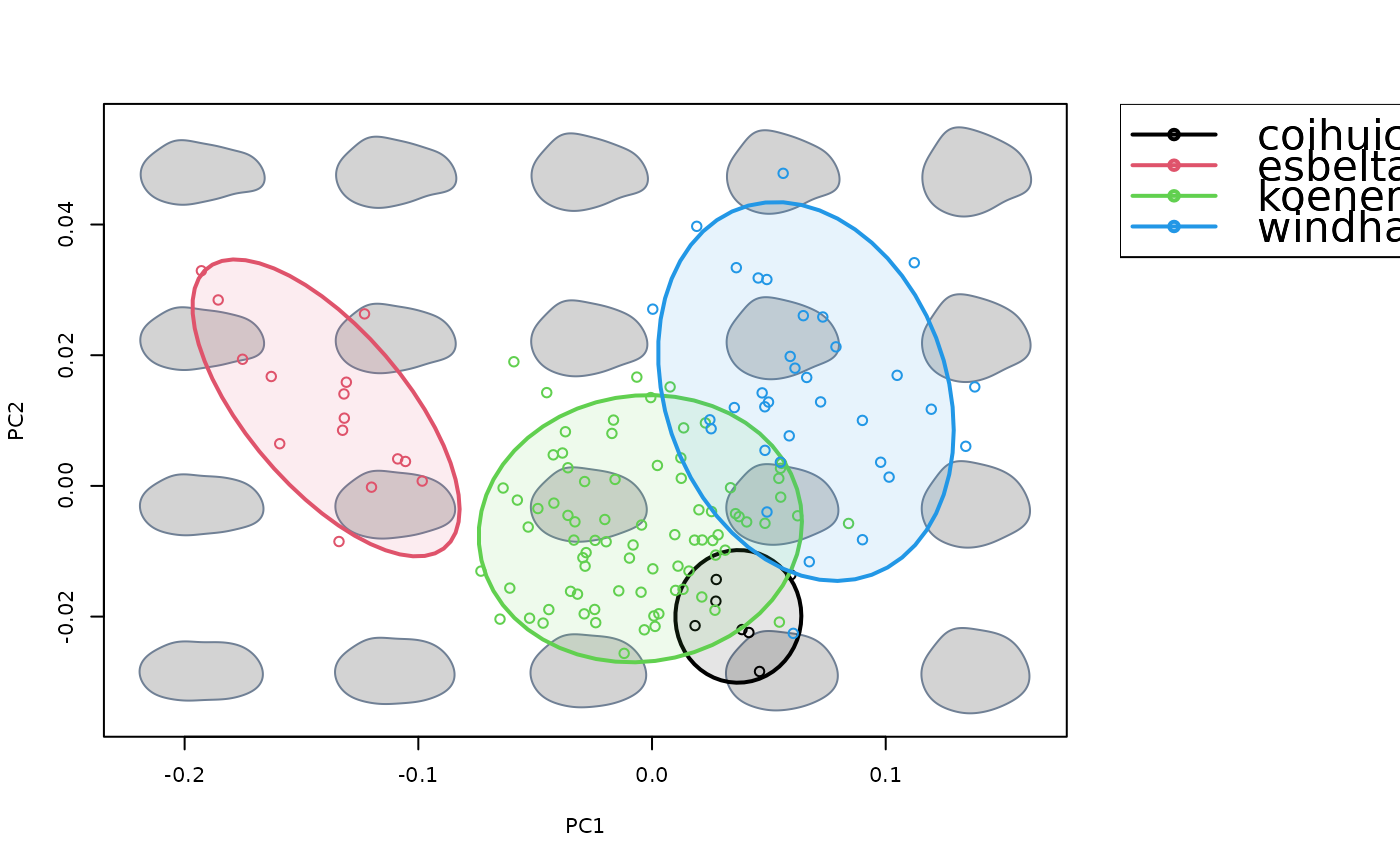
Project convex hulls or confidence ellipses enclosing a priori groups into an existing morphospace.
proj_groups(
  mspace,
  shapes = NULL,
  groups = NULL,
  ellipse = FALSE,
  conflev = 0.95,
  density = TRUE,
  pipe = TRUE,
  ...
)
Arguments
- mspace
An
"mspace"object.- shapes
Optional shape data (if
NULL, the function will look for them first inmspace$projected$scoresand then inmspace$ordination$x).- groups
Factor; classification of observations into groups. Its length must be the same as the number of shapes provided in
shapes.- ellipse
Logical; whether to plot confidence ellipses (if
FALSE, convex hulls will be used instead).- conflev
Numeric; confidence level used for confidence ellipse(s).
- density
Logical; whether to add density distribution for groups (univariate ordinations only).
- pipe
Logical; is the function being included in a pipe?
- ...
Further arguments passed to
hulls_by_group_2D()orellipses_by_group_2D().
Value
If a plot device with a morphospace is open, convex hulls or
confidence ellipses enclosing the scores corresponding to groups
are projected into morphospace. If pipe = TRUE the supplied
"mspace" object will be modified by appending a $gr_class
slot to $projected, as well as by adding some graphical parameters
(stored into the $plotinfo slot), and returned invisibly.
Details
The goal of this function is to add a classification for shapes
populating the morphospace to "mspace" objects, as well as to
facilitate group visualization. Other than that, it is just a wrapper for
hulls_by_group_2D and ellipses_by_group_2D.
See also
Examples
#load and extract relevant data, packages and information
library(magrittr)
data("shells")
shapes <- shells$shapes
species <- shells$data$species
sp_shapes <- expected_shapes(shapes, species)

#generate basic morphospace, add sampled shapes and convex hulls for species
mspace(shapes, links = links, mag = 0.7, axes = c(1,2),
       bg.model = "light gray") %>%
  proj_shapes(shapes = shapes, col = c(1:4)[species], pch = 1) %>%
  proj_groups(groups = species, col = 1:4, lwd = 2, alpha = 0.5)


#generate basic morphospace, add sampled shapes and 95% confidence for
#species
msp <- mspace(shapes, links = links, mag = 0.7, axes = c(1,2),
              bg.model = "light gray") %>%
  proj_shapes(shapes = shapes, col = c(1:4)[species], pch = 1) %>%
  proj_groups(groups = species, col = 1:4, lwd = 2, ellipse = TRUE,
              conflev = 0.95, alpha = 0.1)


#add legend using plot_mspace()
plot_mspace(msp, legend = TRUE, cex.legend = 2, pch.groups = 16)
